
Butterfly population decline in the United States is no longer a theory backed by scattered regional reports.
In March 2025, a landmark study published in Science pulled together data from 76,000+ surveys and 12.6 million individual butterfly records to deliver the clearest picture yet of what’s happening to American butterflies.
The numbers are bad, and knowing them is the first step toward doing something about it.
Key Takeaways
- Total butterfly abundance across the US fell 22% between 2000 and 2020, drawn from 76,000+ surveys spanning 35 monitoring programs
- Of 342 species with enough data to analyze, species were 13 times more likely to be clearly declining than clearly increasing
- 107 species lost more than half their population in 20 years; 22 species declined by more than 90%
- The Southwest saw the steepest regional losses, with cumulative declines of up to 55% over the study period
- Only about 3% of species examined saw population increases, mostly species that tolerate human development
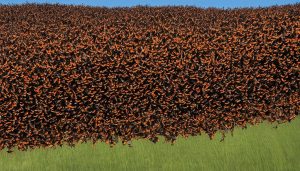
- Recovery is possible: the Eastern Monarch population in Mexico nearly doubled in 2025 compared to the prior year
Table of Contents
- The Study: What Was Measured and How
- The Numbers: Species-Level Breakdown
- Regional Differences: Where It’s Worst
- Why Butterflies Are Declining
- What You Can Actually Do
- Methodology
- FAQ
The Study: What Was Measured and How
For decades, researchers studying butterfly populations faced a fragmented picture. Individual states had their own monitoring programs. Some focused only on monarchs. Others covered small geographic areas for a few years before funding dried up. No one had ever put it all together at a national scale. Until now.
The 2025 Science study, led by Collin Edwards at Washington State University, combined data from 35 butterfly monitoring programs across the contiguous United States.
The dataset spans 2000 to 2020 and includes records from 2,478 unique survey locations. Researchers used statistical models to account for differences in how each program collected data, making results comparable across regions and programs for the first time.
| Study Scale | Number |
|---|---|
| Total butterfly records | 12.6 million |
| Survey events | 76,000+ |
| Monitoring programs included | 35 |
| Unique survey locations | 2,478 |
| Total species in dataset | 554 |
| Species with enough data for trend analysis | 342 |
“This is the most comprehensive assessment of US butterfly population trends ever undertaken,” said Cheryl Schultz, senior author and professor of conservation biology at Washington State University.
The scale matters because regional studies could always be dismissed as local anomalies. This one can’t.
The Numbers: Species-Level Breakdown
The headline 22% decline is alarming enough, but the species-level data tells an even harder story.
Of the 342 species with sufficient data for trend analysis, the ratio of clearly declining species to clearly increasing ones was 13 to 1. This is a broad, systemic collapse hitting butterflies across every family, not a handful of sensitive specialists struggling while hardier species hold steady.
The five species with the steepest overall declines were the Florida white, Hermes copper, tailed orange, Mitchell’s satyr, and West Virginia white. These aren’t obscure insects found only in remote wilderness. Several have historically been common across wide swaths of the country.
22 spp.
The species that were increasing tended to share one trait: tolerance for human-altered landscapes. The gulf fritillary was among those showing gains in parts of its range.
Butterflies that use ornamental plants, survive in suburban gardens, and adapt to fragmented habitat are better positioned than specialists tied to native ecosystems. That’s not a conservation win. It’s a signal about what kind of butterfly world we’re building.
Regional Differences: Where It’s Worst
Butterfly population decline is happening everywhere in the contiguous US, but not equally.
Every region the researchers examined had more declining species than increasing ones. The Southwest posted the worst numbers, with cumulative declines of up to 55% over the 20-year study period.
Researchers attribute this to the compounding effects of extreme heat and worsening drought, both of which have accelerated in the Southwest over the past two decades.
| Region | Median Annual Change | Cumulative 20-Year Decline |
|---|---|---|
| Southwest | -4.0%/yr | up to -55% |
| Southeast | -2.5 to -3.5%/yr | significant decline |
| Midwest | -1.2 to -2.0%/yr | ~21-35% |
| Pacific Northwest | +small increase* | ~+10% (not sustained) |
The Pacific Northwest was the one partial exception, showing a small apparent increase over the study period.
Researchers were careful to flag that this was largely driven by a population boom in the California tortoiseshell, one they don’t expect to hold. It’s the kind of statistical outlier that can make averages misleading if you don’t look beneath them.
The Midwest data carries its own weight. A separate 2025 PNAS study looked at three decades of butterfly monitoring data across the Midwest.
It found that not a single one of the 136 species tracked showed a population increase from 1992 to 2023. Zero out of 136. That’s not a mix of winners and losers, but a uniformly declining community across all functional groups.
Why Butterflies Are Declining
The study doesn’t pin butterfly population decline on a single cause, because there isn’t one. Three forces are working together, and in many regions they’re compounding each other in ways that are hard to separate.
Pesticides, Especially Neonicotinoids
Research co-authored by study co-author Leslie Ries found that pesticides, particularly neonicotinoids, are strongly linked to butterfly declines.
A 2024 study published in PLOS ONE found that insecticides, more than herbicides, land use changes, or climate, were the dominant driver of butterfly species richness and abundance declines in the American Midwest.
A separate 2025 study found individual monarch butterflies carrying traces of up to seven different neurotoxic pesticides simultaneously.
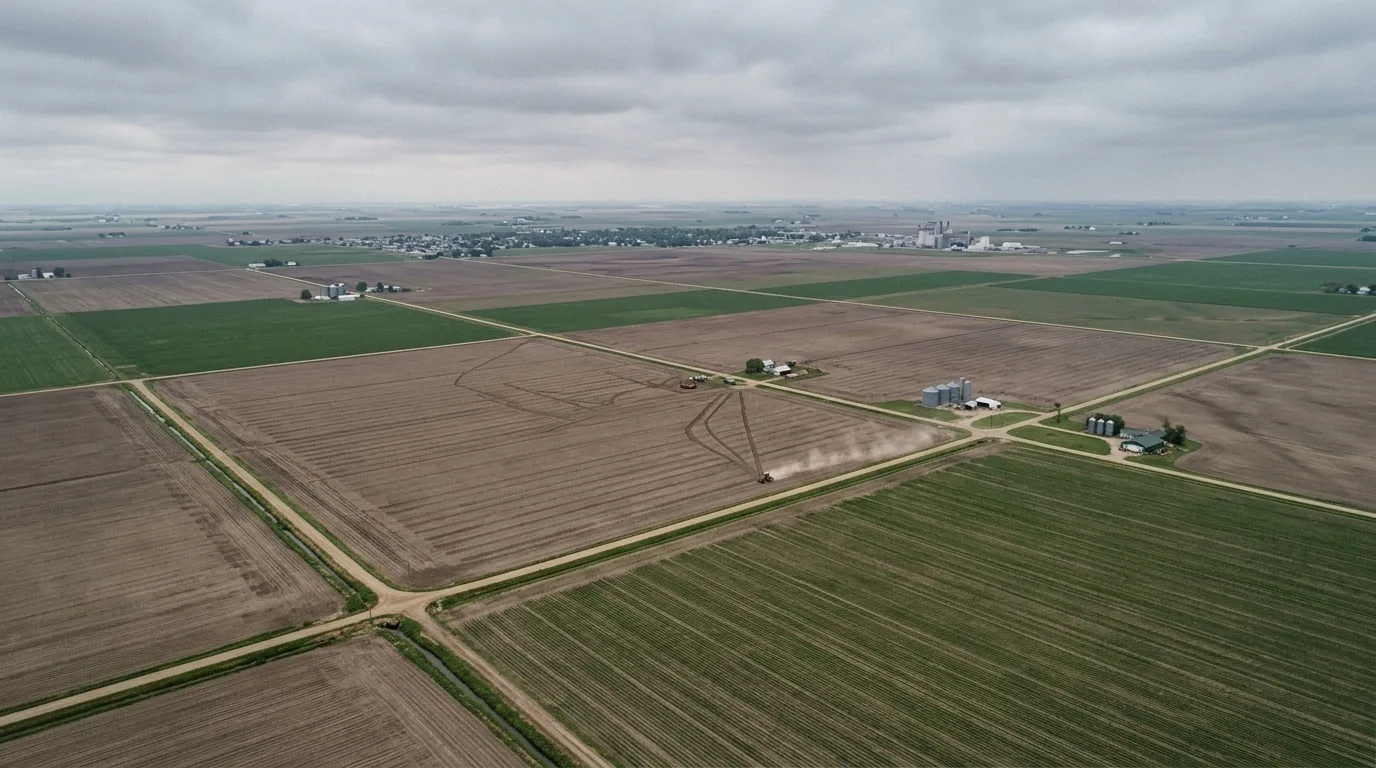
Large-scale conversion of natural lands to agriculture and development has stripped away the host plants butterflies need to reproduce and the nectar sources adults need to survive.
This isn’t a new problem, but it’s one that has been accelerating. Nick Haddad, a study co-author and professor at Michigan State University, noted that roughly 20% of cropland produces poor yields, land that could be restored to native habitat but isn’t.
Butterflies are ectothermic, meaning their body temperature depends on their environment. That makes them acutely sensitive to heat and drought.
The study found that declines were most severe in the arid, warming Southwest, consistent with what researchers have observed in other climate-sensitive butterfly studies.
A 2024 study found that 71% of Southeast Asian butterflies are losing habitat because they’re migrating faster than the plants they depend on can follow.
What You Can Actually Do
The scale of butterfly population decline can feel paralyzing.
The researchers behind this study are explicit that recovery is possible. Butterflies have short life cycles, which means populations can rebound quickly when conditions improve.
The bottleneck is creating those conditions.
A few actions with documented impact:
“Butterflies need host plants on which to lay eggs, wildflowers on which to feed, a refuge from pesticides, and sites to overwinter,” said Scott Black, director of the Xerces Society and co-author of the study.
“There is hope for these animals if we focus on providing habitat for butterflies across all landscapes, from cities and towns to agricultural lands to natural areas.”
If you’re building a butterfly-friendly space and want to go beyond nectar plants, the butterfly garden guide on this site covers layout, plant selection, and how to think about habitat from a butterfly’s perspective.
For monarchs specifically, the monarch and milkweed page breaks down why that relationship matters and which milkweed species to choose.
Methodology
All statistics in this article come directly from peer-reviewed sources. The primary source is Edwards et al. (2025), published in Science (Vol. 387, pp. 1090-1094, DOI: 10.1126/science.adp4671).
Regional decline data comes from the same study. The Midwest three-decade analysis is from a separate 2025 study published in PNAS. The 71% Southeast Asian habitat figure comes from reporting on 2024 research compiled by naturefactshub.com.
The pesticide-specific findings reference Van Deynze et al. (2024) in PLOS ONE (DOI: 10.1371/journal.pone.0304319). No statistics in this article are fabricated or estimated.
FAQ
How much have butterfly populations declined in the US?
Total butterfly abundance in the contiguous United States fell by 22% between 2000 and 2020, according to the most comprehensive national study ever conducted.
That works out to roughly 1.3% per year, which compounds to a significant loss over two decades.
For every five butterflies present in 2000, only four remained by 2020.
Which butterfly species are declining the most?
The five species with the steepest declines in the 2025 Science study were the Florida white, Hermes copper, tailed orange, Mitchell’s satyr, and West Virginia white.
Of the 342 species with enough data for trend analysis, 107 lost more than 50% of their population over the 20-year study period.
22 species declined by more than 90%.
What is the main cause of butterfly population decline?
Three overlapping causes drive most butterfly declines: pesticide use (especially neonicotinoid insecticides), habitat loss from agricultural expansion and development, and climate change.
Research published in 2024 found that insecticides were the dominant driver of declines in the Midwest, outweighing the effects of herbicides, land use, and climate in that region.
In hotter, drier areas like the Southwest, climate change appears to be the amplifying factor that pushes already-stressed populations further down.
Can butterfly populations recover?
Yes, and this is one reason researchers remain cautiously hopeful.
Butterflies have short life cycles compared to many other species, which means populations can grow back quickly when conditions improve.
The Eastern Monarch population in Mexico nearly doubled in 2025 compared to the previous year, showing rapid recovery is possible.
The challenge is creating and protecting the right conditions: host plants, pesticide-free habitat, and overwintering sites.
Sources
- Edwards, C.B., et al. (2025). Rapid butterfly declines across the United States during the 21st century. Science, 387(6738), 1090-1094. doi.org/10.1126/science.adp4671
- Van Deynze, B., et al. (2024). Insecticides, more than herbicides, land use, and climate, are associated with declines in butterfly species richness and abundance in the American Midwest. PLOS ONE. doi.org/10.1371/journal.pone.0304319
- Xerces Society. (March 6, 2025). Study Finds That US Butterfly Populations Are Severely Declining. xerces.org
- USGS. (March 21, 2025). America’s Butterfly Populations Down 22% over Past Two Decades. usgs.gov
- PNAS. (2025). Three decades of declines restructure butterfly communities in the Midwestern United States. pnas.org